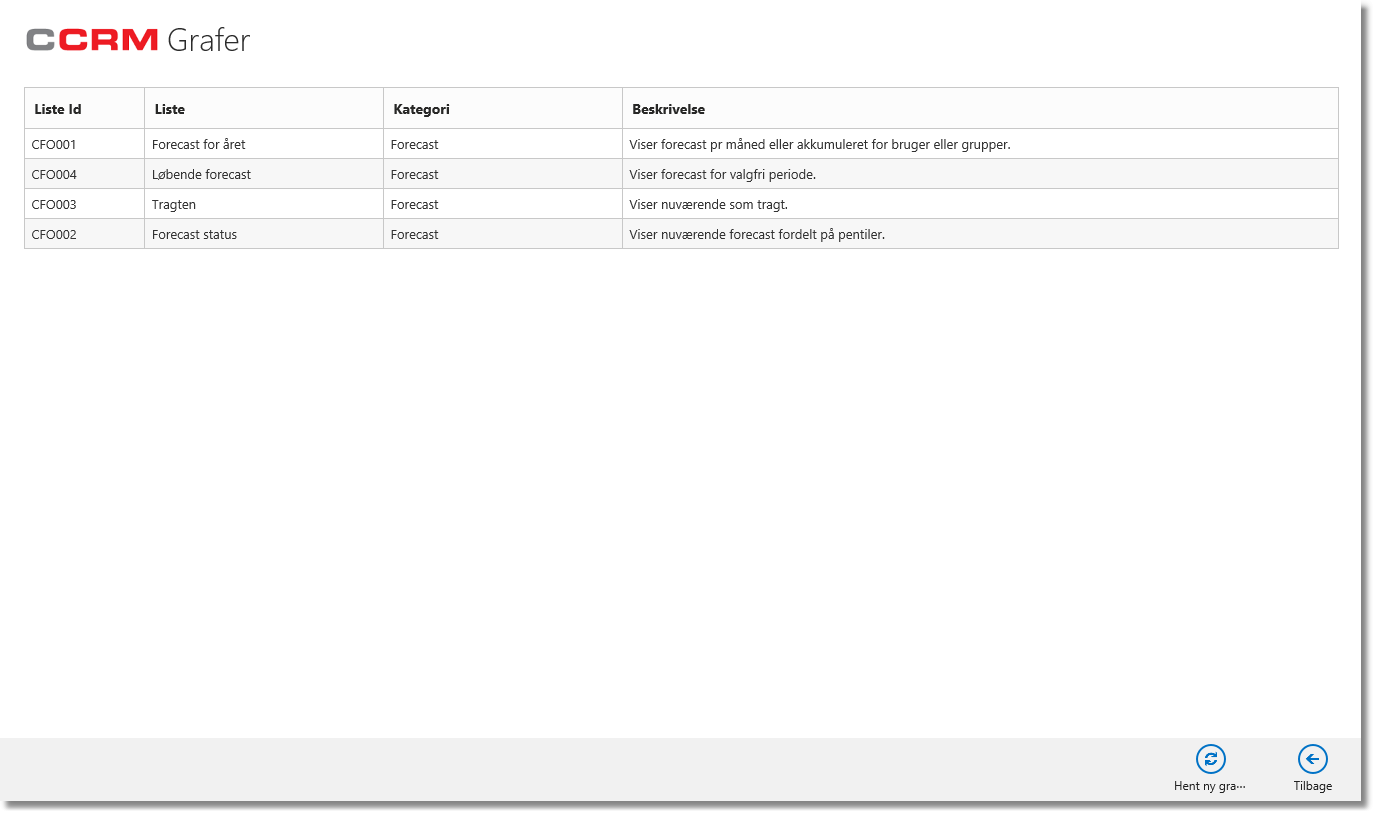
Graphs are dynamic charts of (for example) forecast data with associated data in tabular form. This way you can easily see what is behind the curves. And possibly navigate to the underlying data.
URL of this topic:
https://channelcrmhelp.com/index.html?charts.htm